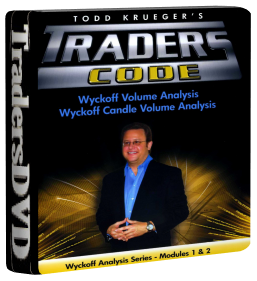
Todd Krueger – Wyckoff Analysis Series Modules 1 & 2 – Combined 5 DVD Trading Course
This powerful trading course exposes the market tactics and maneuvers used by smart money traders to consistently hoodwink the uninformed trader from their money.
Product Description
This powerful trading course exposes the market tactics and maneuvers used by smart money traders to consistently hoodwink the uninformed trader from their money. Almost all retail traders lose their money to these market professionals. Why? Because they have never developed the chart reading skills necessary to reveal which side of the trade the smart money are really on. Think about all those times that you may have bought market highs and then immediately, after placing your trade, the market drops. What happened? The smart money moved the price to establish a following and in doing so, manipulated the perception of the general public (the herd) into falsely believing that the market would continue on to much higher prices. This course teaches you how they do it and how to make sure that it doesn’t happen to you. More importantly, it teaches you how to use the smart money to win in the markets that you trade in!
Here is a breakdown of what you will learn from this 3 DVD Home Study Course:
• How to Identify the Imbalance of Supply/Demand from the Smart Money
• Determine Which Side of the Market the Smart Money is Trading From
• Understand How Smart Money Moves Price to Manipulate the Public’s Perception
• Recognize How Smart Money Creates the Fear/Greed Cycle in the Public
• How to Profit from the Herd Mentality Created by the Smart Money
• Expose the Inventory Cycle used by the Smart Money
• The Importance of Multiple Timeframe Analysis to Confirm Smart Money’s True Intentions
• How the Media Assists the Smart Money in Manipulating the Public
• Understand the Psychology of Professional Traders from the Price Chart
• The 7 Common Retail Trader Traps and How You can Avoid Them
• 3 Surefire Techniques to Identify Market Strength
• 3 Surefire Techniques to Identify Market Weakness
• Money Making Secrets Revealed that will Improve Your Trading Results
Here is a breakdown of what you will learn from this 2 DVD Home Study Course:
• How to use multiple timeframes in harmony with the major trend
• How to use longer term charts to reduce the noise level in a chart
• See how Wyckoff Candle Volume patterns produce readable market tells
• How to use longer term charts to set up the directional bias for the day trader
• Identify WCVA patterns that produce support/resistance levels
• How to use WCVA charts in the FOREX market
• How to scientifically break multiple timeframes down to confirm supply/demand


